GRAPHING ABSOLUTE VALUE EQUATIONS
The Absolute Value Function is y = │x│.
For every value of “x”, y
is positive.

This graph is the shape of a “V”, starting from the origin (0, 0) and going out (in both directions) and up at 45 degree angles. Whatever “x” is, “y” is the positive value of “x”. This graph is often referred to as the parent graph (in other words the basic/generic graph).
For the absolute value function y = -│x│,
For every value of “x”, y
is negative.

This graph is the shape of a “V”, starting from the origin (0, 0) and going out (in both directions) and down at 45 degree angles. Whatever “x” is, “y” is the negative value of “x”. The parent graph is flipped.
For the absolute value function y = │x│ + 3,
You move the absolute
value function graph y = │x│ (the parent graph) up the y-axis three
units. The +3 tells you the vertex of the graph. When x = 0, y = 3.

If you were given the graph above and asked to write an equation, normally you are also given the parent graph y = │x│. You know the equation of the parent graph. Now you need to indicate the change in position up the y-axis. That number is added outside the second absolute value bar. y = │x│ + 3
For the absolute value function y = │x│ – 5,
You move the absolute
value function graph y = │x│ (the parent graph) down the y-axis five
units. The -5 tells you the vertex of the graph. When x = 0, y =
-5.

If you were given the graph above and asked to write an equation, normally you are also given the parent graph y = │x│. You know the equation of the parent graph. Now you need to indicate the change in position down the y-axis. That number is added outside the second absolute value bar. y = │x│ + (-5) = y = │x│ – 5
For the absolute value function y = │x + 4│,
You move the absolute
value function graph y = │x│ (the parent graph) left on the x-axis four
units. The value of x inside the absolute value bars must be -4 for the
absolute value term to equal zero. This is the vertex of the graph.
When x = -4, y = 0.

If you were given the graph above and asked to write an equation, normally you are also given the parent graph y = │x│. You know the equation of the parent graph. Now you need to indicate the change in position left on the x-axis. Determine what number needs to be added to the location on the x-axis for the absolute value to equal zero. Since “x” is -4, +4 must be added to “x”. You add the +4 inside the absolute value bars. y = │x + 4│
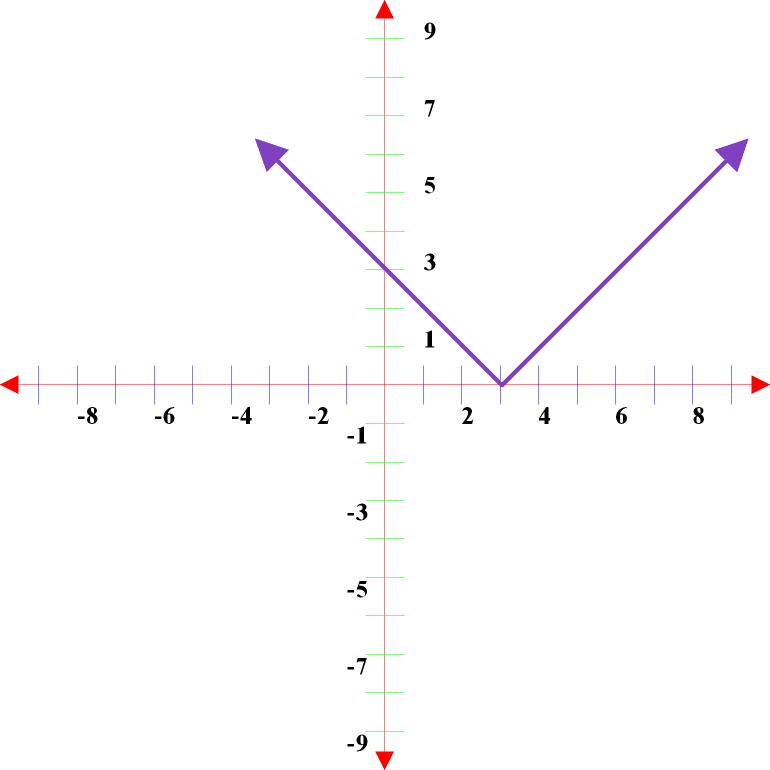
For the absolute value function y = │x – 3│,
You move the absolute
value function graph y = │x│ (the parent graph) right on the x-axis three
units. The value of x inside the absolute value bars must be 3 for the
absolute value term to equal zero. This is the vertex of the graph.
When x = 3, y = 0.

If you were given the graph above and asked to write an equation, normally you are also given the parent graph y = │x│. You know the equation of the parent graph. Now you need to indicate the change in position right on the x-axis. Determine what number needs to be added to the location on the x-axis for the absolute value to equal zero. Since “x” is 3, -3 must be added to “x”. You add the -3 inside the absolute value bars. y = │x – 3│
For the absolute value function y = -│x + 3│ + 4,
You flip the absolute
value function graph y = │x│(the parent graph) because of the negative sign in
front of the absolute value bars, move left on the x-axis three units, and up
four units. The value of x inside the absolute value bars must be -3 for
the absolute value term to equal zero. The +4 tell you the y-coordinate
of the vertex. When x = -3, y = 4. This is the vertex of the graph
(-3, 4).

If you were given the graph above and asked to write an equation, normally you are also given the parent graph y = │x│. You know the equation of the parent graph. First indicate the flipped graph with a negative sign in front of the absolute value bars. Now you need to indicate the change in position of the vertex up the y-axis by adding this value outside the second absolute value bar. y = -│x│ + 4
Now you need to indicate
the change in position of the vertex left on the x-axis. Determine what
number needs to be added to the location on the x-axis for the absolute value
to equal zero. Since “x” is -3, +3 must be added to “x”. You add
the +3 inside the absolute value bars. y
= -│x + 3│ + 4
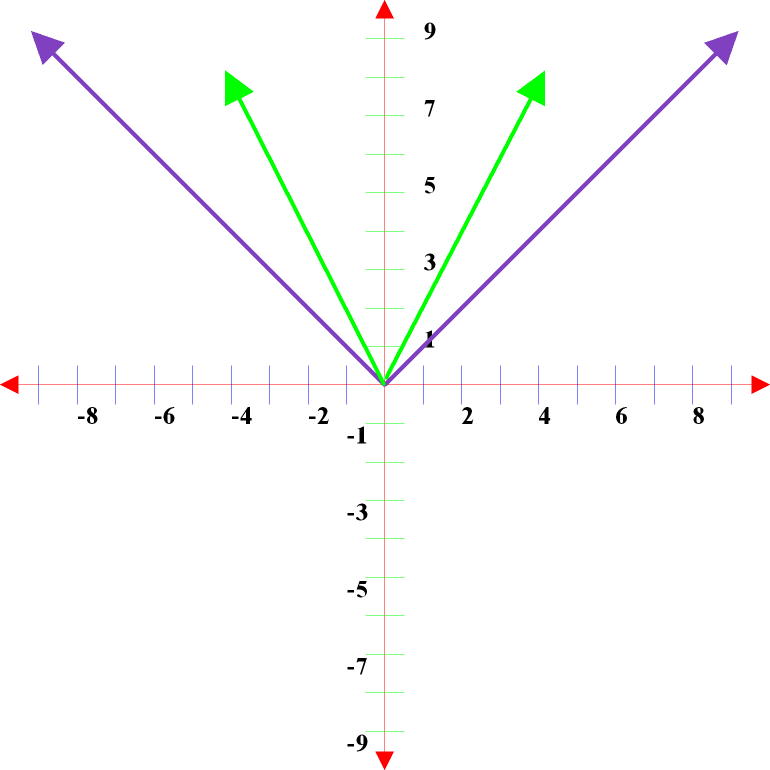
For the absolute value functions y = 2│x│ or y = │2x│
The absolute value
function graph y = │x│ (the purple graph) becomes steeper (thinner) (the green
graph). The larger the number, the thinner the graph. To accurately
graph these equations, use a negative and a positive value for “x” and solve
for “y” to get two sets of coordinate points. You only need two points to
draw a straight line. You already know the vertex point (0, 0).

If you were given the graph above and asked to write an equation, normally you are given the parent graph y = │x│ (the purple graph). You know the equation of the parent graph. Now you need to determine how steep is the green graph. That number goes in front of the “x” or outside the first absolute value bar. The right green line goes through the point (1, 2), so the slope of this line is 2/1, which equals 2! y = 2│x│ or y = │2x│
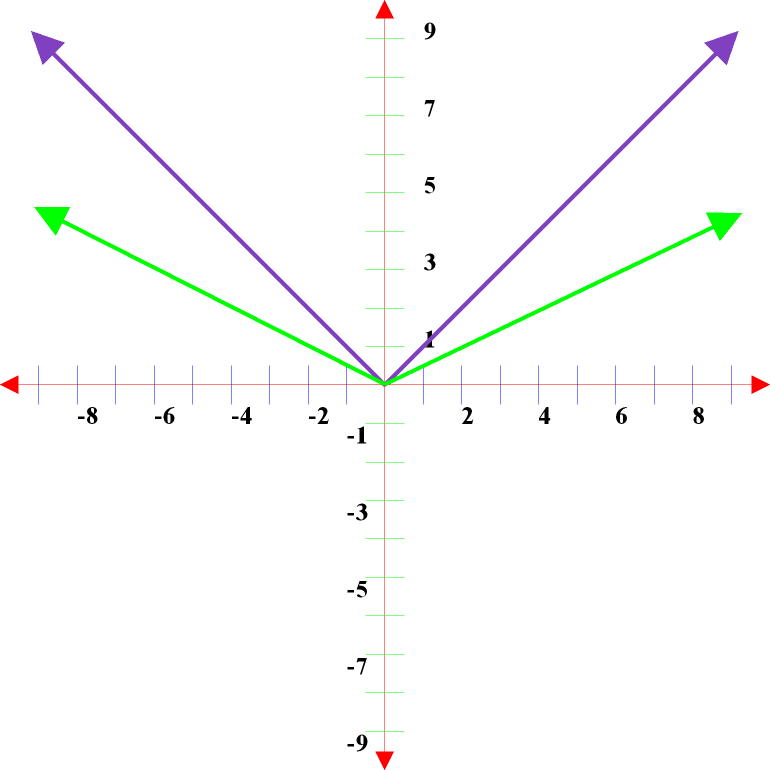
For the absolute value functions y = ½│x│ or y = │(½)x│
The absolute value
function graph y = │x│ becomes less steep (wider). The smaller the number
(the fraction), the wider the graph. To accurately graph these equations,
use a negative and a positive value for “x” and solve for “y” to get two sets
of coordinate points. You only need two points to draw a straight
line. You already know the vertex point (0, 0).

If you were given the graph above and asked to write an equation, normally you are given the parent graph y = │x│ (the purple graph). You know the equation of the parent graph. Now you need to determine how steep is the green graph. That number goes in front of the “x” or outside the first absolute value bar. The left green line goes through the point (-2, 1), so the slope of this line is -1/2. Be careful here. The negative would indicate the parent graph was flipped. The slope is 1/2 not -1/2! y = ½│x│ or y = │(½)x│
For the absolute value functions y = │x│2 or y = │x2│
We cannot graph this by adjusting the graph of y = │x│.
This graph is a parabola. This is now a quadratic equation.
The standard form of a quadratic equation is ax2 + bx + c = 0, if a ≠ 0.
If a = 0, then the equation becomes a linear equation bx + c = 0.
To learn how to
graph parabolas, please listen to the lesson on quadratic equations.
Hopefully I was successful in teaching you to work with Absolute Values.
Please go to the website blog and let me know.
The website address is www.mathbeast.com.
Copyright 2008 www.mathbeast.com. All rights reserved.