
LINEAR EQUATIONS
What is a linear equation?
A linear equation is an equation of a straight line.
Linear Equations have the form y = mx + b.
The variable “m” represents the slope of the line.
The variable “b” represents the y-intercept of the line.
Note: A linear
function is a set of ordered pairs (x, y) that represent a straight line.
We say “y” is a function of “x”, because the value of “y” is dependent on the value of “x”.
EXAMPLES OF LINEAR EQUATIONS:
y = 3x + 7
y = 5x + 25
y = -15x
x = -5y + 27
There are three ways to use a linear equation to draw a graph of the line.
Method 1:
This point is (0, b). Where the line crosses the y-axis, x = 0.
Note: When x = 0 y = m(0) + b y = b
If “m” is a positive number, the line falls from right to left. /
If “m” is a negative number, the line falls from left to right. \
A slope that is an integer goes up (or down) that amount and over (left or right) 1 unit.
A slope that is a fraction goes up (or down) the amount of the numerator, and over (left or right) the amount of the denominator.
To graph a line using this
method, plot the y-intercept point and then use the slope to plot one more
point.
You only need two points to draw a straight line!
Note: I generally plot three points for safety. I use the slope to find the point above and the point below the y-intercept.
Method 2:
This point is (0, b). Where the line crosses the y-axis, x = 0.
Note: When x = 0 y = m(0) + b y = b
y= mx + b y – b = mx (y-b)/m = x
Where the line crosses the x-axis, y=0.
Note: When y = 0 (0-b)/m = x x = -b/m
To graph a line using this method, plot the y-intercept point and then plot the x-intercept point. You only need two points to draw a straight line!
Method 3:
Substitute various values for “x”, and then solve the equation for “y”.
Calculate a minimum of three pair of points.
Note: For simplicity, I generally use the integers 0, 1, 2, -1 and -2 for my values of “x”. These values usually make calculating “y” easy.
A Cartesian coordinate system
is seen as a piece of graph paper with two axes drawn on it. The
horizontal axis is called the x-axis. The vertical axis is called the
y-axis. The axes divide the graph paper into four regions called
quadrants. The quadrants are numbered counterclockwise, beginning in the
upper right quadrant where both variables are positive.

Coordinate points are written in this form: (x, y). “x” values are called domains. “y” values are called ranges.
In linear functions, the domains (“x” values) are the independent variables.
In linear functions, the ranges (“y” values) are the dependent variables.
I generally use Method 1 to graph linear equations because all I have to do is read. No calculations are required! I will now show you how to graph linear equations utilizing each method.
Method 1 – Graphing Linear Equations
Problem A: y = 2x + 3
y-intercept = 3 slope = 2/1
(0, 3) (1,
5)
y-intercept = -4 slope = -1/1
(0, -4) (1,
-5)

y-intercept = -2 slope = 2/3
(0, -2) (3,
0)
Method 2 – Graphing Linear Equations
Problem A: y = 2x + 3
y – 3 = 2x (y-3)/2 = x (0-3)/2 = x = (- 3/2) = -1.5
y-intercept = 3 x-intercept = -1.5
y + 4 = -x (y+4)/-1= x (0+4)/-1 = x = (4/-1) = -4
y-intercept =
-4 x-intercept = -4
y + 2 = (2/3)x y+2/m = x = (y + 2) Ă· (2/3) = (y + 2) (3/2)
x = (3y+6)/2 When y = 0, x = 6/2 = 3
y-intercept =
-2 x-intercept = 3
Method 3 – Graphing Linear Equations
Problem A: y = 2x + 3
(0, ?) (1, ?) (2, ?) (-1, ?) (-2, ?)
y = 2(0) + 3 = 3
y = 2(1) + 3 = 5
y = 2(2) + 3 = 7
y = 2(-1) + 3 = 1
y = 2(-2) + 3 = -1
|
y |
|
|
0 |
3 |
|
1 |
5 |
|
2 |
7 |
|
-1 |
1 |
|
-2 |
-1 |
(0, 3) (1, 5) (2, 7) (-1, 1) (-2, -1)
(0, ?) (1, ?) (2, ?) (-1, ?) (-2, ?)
|
y |
|
|
0 |
-4 |
|
1 |
-5 |
|
2 |
-6 |
|
-1 |
-3 |
|
-2 |
-2 |
(0, -4) (1, -5) (2, -6) (-1, -3) (-2, -2)
(0, ?) (3, ?) (6, ?) (-3, ?) (-6, ?)
|
y |
|
|
0 |
-2 |
|
3 |
0 |
|
6 |
2 |
|
-3 |
-4 |
|
-6 |
-6 |
(0, -2) (3, 0) (6, 2) (-3,
-4) (-6, -6)
Now do you see why I prefer to use method 1? All I have to do is read the equation. In fact I can graph most equations, not just linear equations, simply by reading the equation. I’ll show you how in other lessons!
Time for you to graph a few linear equations!
Practice 1:Â Â Â Â Â Â Â Â Â Â Â Â Â Â Â Â Â Â Â Â Â y = 3x + 4
Practice 2:                y = -2x –
3
Practice 3:Â Â Â Â Â Â Â Â Â Â Â Â Â Â Â Â y = (3/4)x
– 2
AUDIO
How to Write a Linear Equation from a Graph
You can quickly write a linear equation from looking at a graph of a straight line. All you need are two sets of coordinate points.
If you can see the x-intercept (x, 0) and the y-intercept (0, y), use these two points. If not use any two sets of coordinate points you can see.
The slope of the line equals the rise over the run. Calculate the slope from your two sets of points. Subtract the first “y” from the second “y” and divide by the first “x” subtracted from the second “x”. This will give you the value of “m”. Now all you need is the y-intercept.
Now that I know the slope, I can perform the same procedure I did to find the slope to find the y-intercept. I can subtract the coordinate point (0, y), which is the y-intercept from either of my original coordinate points and set those equal to the slope I calculated. The only unknown is the y-intercept.
Let me show you how!
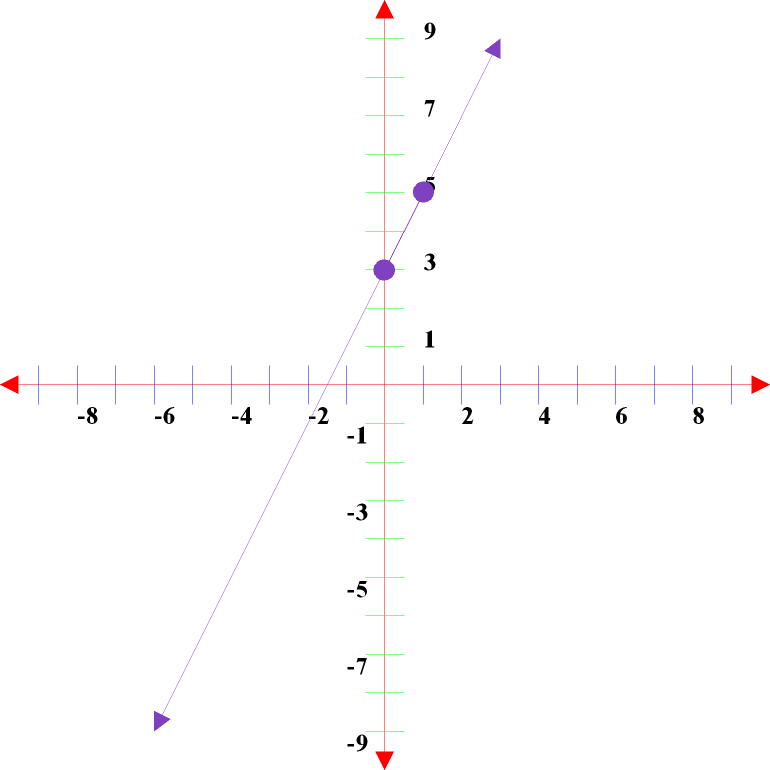
EXAMPLE A:

I can see that the line goes through the points (1, 3) and (3, 9).
I first calculate the slope. m = (9-3)/(3-1) = 6/2 = 3
Next I perform the same procedure using (0, b) as one of the coordinates.
3 = m = (9-b)/(3-0) = (9-b)/3 = 3               (3) (9-b/3) = 3 (3)               9 – b = 9        b = 0
The y-intercept is the origin point at 0.
Now I can write the equation.
y = 3x + 0Â Â Â Â Â Â Â Â Â Â Â Â Â Â Â y = 3x
Often people fail to recognize this equation as a straight line because the y-intercept is not written.
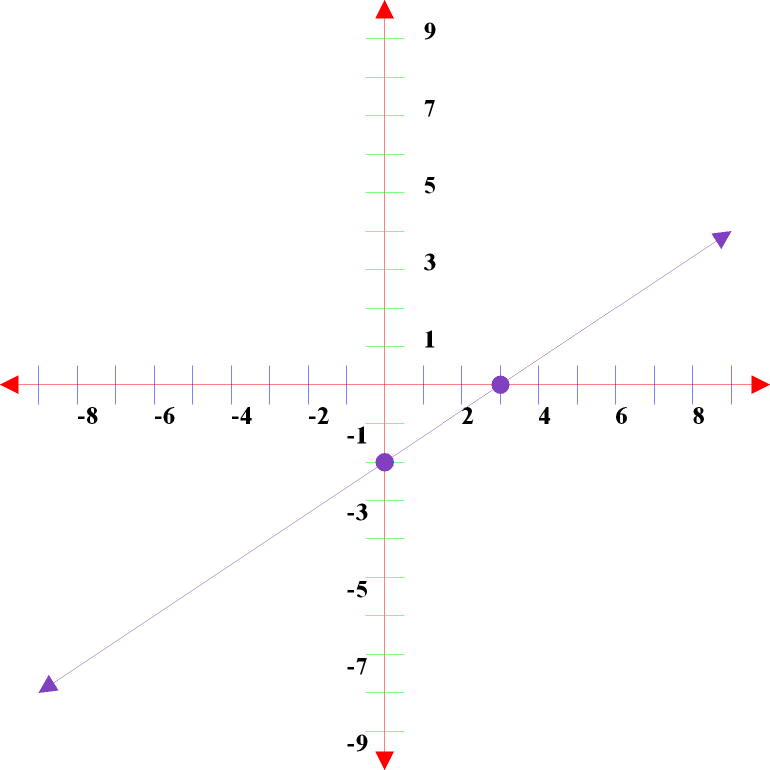
EXAMPLE B:

I can see that the y-intercept is 5 (0, 5), and the x-intercept is -3 (-3, 0).
I first calculate the slope. m = (5-0)/(0+3) = 5/3
Now I can write the equation.
This equation could also be written y = (12/3)x + 5 = (1.666)x + 5
Always change “m” to a fraction for ease in plotting a straight line.
EXAMPLE C:
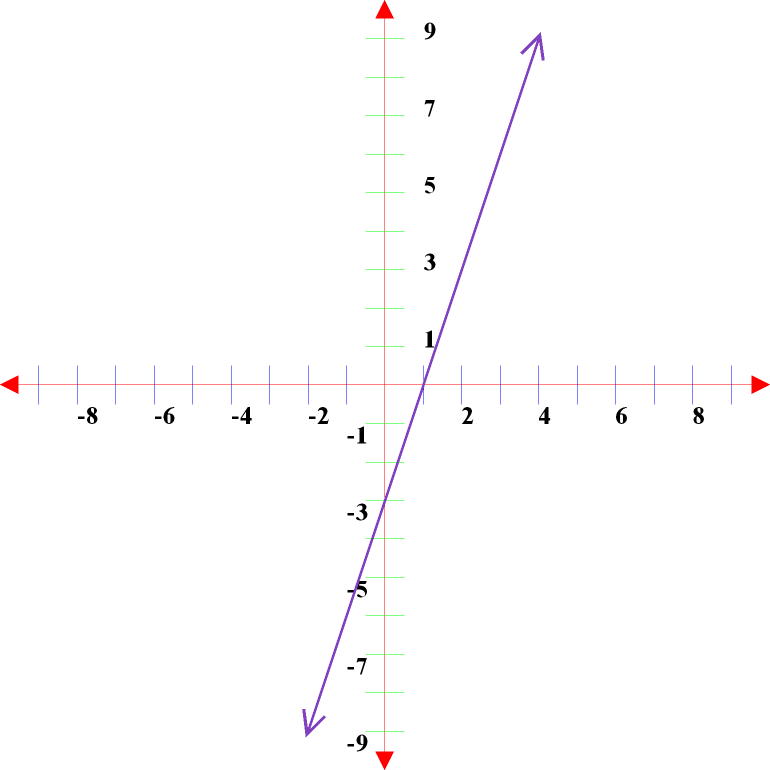
I can see that the y-intercept is (0, -3) and that the line goes through the points (2, 3).
I first calculate the slope. m = (3+3)/(2-0) = 6/2 = 3
Now I can write the equation.
y = 3x – 3        Easy!!!
Now here are a few for you to
try!
Practice 1:Â Â Â Â Â Â Â Â Â Â Â Â Â Â Â Â Â Â Â Â Â

Practice 2:Â Â Â Â Â Â Â Â Â Â Â Â Â Â Â Â Â Â Â Â Â
Practice 3:Â Â Â Â Â Â Â Â Â Â Â Â Â Â Â Â Â Â Â Â Â

On page 1 under “EXAMPLES
OF LINEAR EQUATIONS” were the following three equations that are not written in
the standard form y = mx + b.
I am going to do the math to convert these equations to the standard form.
Example 1:
x = -5y + 27
Example 2:
x = (- 2/3)y + 58
(- 3/2)x + (3 x 29) = y
y= (- 3/2)x + 87
Example 3:
x + 2 = 3y
I hope this lesson was helpful.
Please go to the website blog and let me know whether I successfully taught you to write and graph linear equations.
The
website address is www.mathbeast.com
Copyright
2008 www.mathbeast.com/